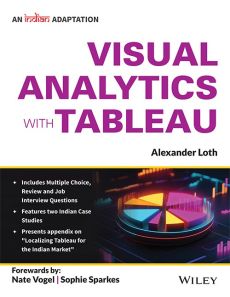
Visual Analytics with Tableau, An Indian Adaptation
ISBN: 9789363863477
316 pages
Publication Year: 2025
For more information write to us at: acadmktg@wiley.com

Description
Tableau is a leading data visualization tool that’s simple enough for individual desktop users and robust enough for enterprise solutions. Widely used by financial analysts, marketers, statisticians, business leaders, and sales professionals, Tableau makes it easy to present data visually for quick and clear decision-making in today’s data-driven world.
Visual Analytics with Tableau takes non-technical business users on a complete journey — starting from zero, connecting data, and creating impactful visualizations and dashboards to unlock business insights.
Preface
About the Author
About the Technical Editors
Credits
Acknowledgments
Foreword by Nate Vogel
Foreword by Sophie Sparkes
Introduction
Chapter 1: Introduction and Getting Started with Tableau
Chapter 2: Adding Data Sources in Tableau
Chapter 3: Creating Data
Chapter 4: Aggregate
Chapter 5: Table
Chapter 6: Maps
Chapter 7: Advanced Analytics: Trends, Forecasts, Clusters, and other Statistical Tools
Chapter 8: Interactive Dashboards
Chapter 9: Sharing Insights with Colleagues and the World
Chapter 10: Data Preparation with Tableau Prep
Case Study 1
Case Study 2
Appendix A
Appendix B
Index

